+60115141083

finserv0919@gmail.com

Categories
Fundamental Analysis with FinServCorp Uncategorized

Understanding the power of Non-Farm Payrolls (NFP) in the Financial Markets with The Trading Academy

In the world of finance, few economic indicators hold as much weight as the Non-Farm Payrolls (NFP). Released on the first Friday of every month, the NFP report can send ripples throughout the financial markets, influencing everything from currency values to stock prices. But what exactly is the NFP, and why does it matter so much? Let’s dive in.

What exactly is Non-Farm Payrolls (NFP)?

The Non-Farm Payrolls report represents the number of jobs added or lost in the U.S. economy over the last month, excluding jobs in the farming industry. The farming industry is excluded due to its seasonal hiring, which could potentially skew the data. The NFP is a critical economic indicator because employment is a significant factor in determining the health of an economy.

How does NFP data affect Economics as whole?

  • Consumer Spending: Employment levels directly influence consumer spending. When employment is high, consumers have more disposable income, leading to increased spending and, consequently, economic growth.

  • Central Bank Policies: Central banks, like the Federal Reserve, closely monitor the NFP. Strong employment numbers might lead to interest rate hikes to curb inflation, while weak numbers could lead to rate cuts to stimulate borrowing and investment.

  • Investor Sentiment: The NFP can influence investor sentiment. Positive numbers can boost confidence, leading to increased investment in stocks, while negative numbers can have the opposite effect.

You can check public sentiment data in myfxbook:

https://www.myfxbook.com/community/outlook

NFP and the Dollar Index

The Dollar Index measures the value of the U.S. dollar relative to a basket of foreign currencies. Since the U.S. economy plays a pivotal role in the global economy, any significant news, like the NFP, can influence the Dollar Index.

  • Positive NFP Readings: A higher-than-expected NFP reading can strengthen the U.S. dollar as it indicates a robust U.S. economy. A strong economy can attract foreign investment, increasing demand for the U.S. dollar.

  • Negative NFP Readings: A lower-than-expected NFP reading can weaken the U.S. dollar. A weak employment number can signal economic slowdown, making U.S. assets less attractive to foreign investors.

NFP’s influence on Technical Analysis

While this blog post won’t delve deep into technical analysis, it’s essential to understand that fundamental data like the NFP can influence technical patterns. For instance:

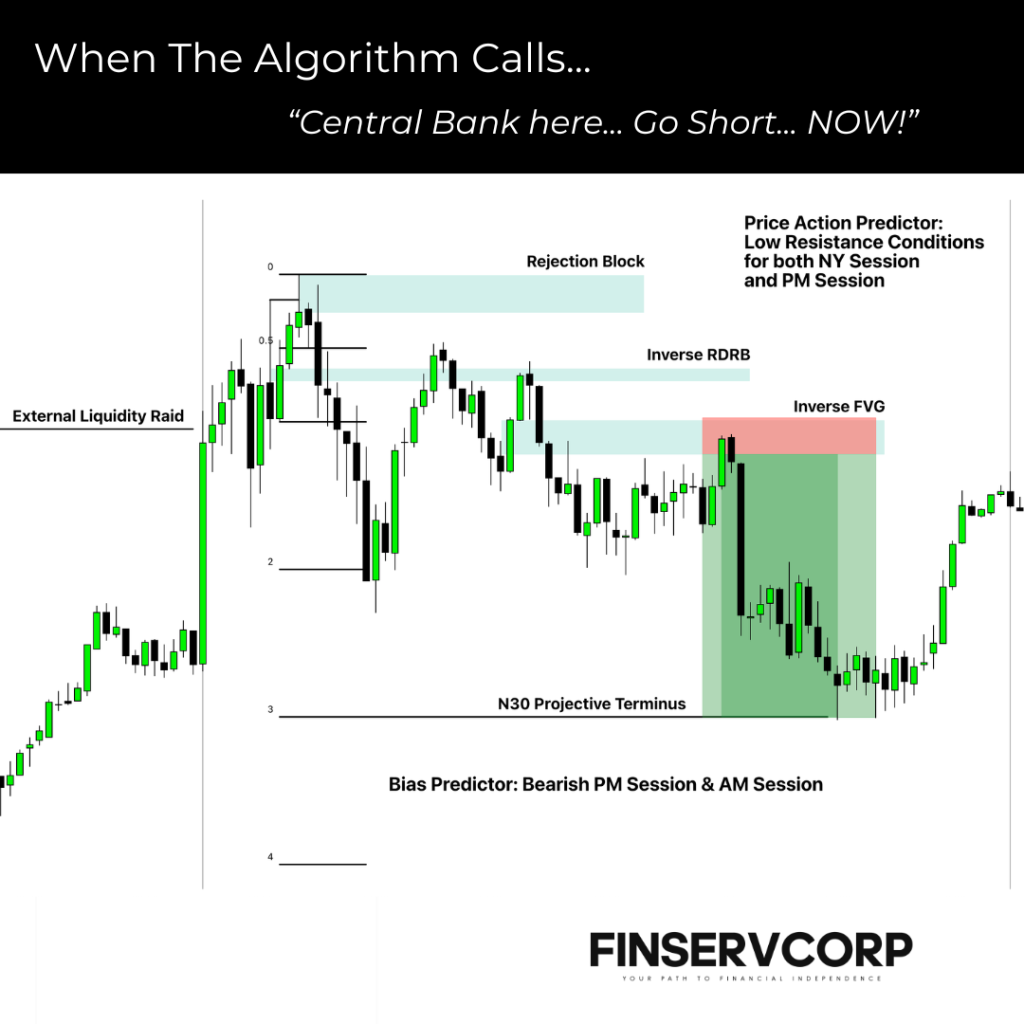
  • Price Volatility: On NFP release days, traders can expect increased price volatility, leading to potential breakouts or reversals in existing trends through filling inefficiencies and raiding external liquidity pools

  • Support and Resistance Levels: Strong NFP numbers can push prices to test Premium levels, while weak numbers can lead to tests of Discount levels.

Concluding Note

The Non-Farm Payrolls report is more than just a number. It’s a reflection of the U.S. economy’s health and a significant driver of financial market movements. Whether you’re a trader, investor, or just someone keen on understanding the economy, keeping an eye on the NFP can offer valuable insights into the broader economic landscape.

Stay tuned for more insights and deep dives into the world of finance and trading with The Trading Academy!

Categories
Uncategorized When the Algorithm Calls

When the Algorithm Calls: NASDAQ Bearish Bias Prediction for the 8th of September 2023

The ‘Hindsight’ Image

The Analysis

This trade was called out in the following YouTube video:

Now, over here based on the analysis is that price took out External Liquidity As we know, based on the function of price in terms of its sequence of movement, a reversal will always form around an External Liquidity Pool. To further add to that point, an expansion in the direction of actual order flow will then be facilitated through the usage of Fair Value points of interests.

Now, these Fair Value points of interests come in many forms:

  • Your True Fair Value Gap
  • Balanced Price Range (BPR)
  • Inverse Fair Value Gap
  • Inverse Redelivered Rebalance

I know what you are thinking:

‘BPR and Inverse Fair Value Gaps are the same !’

I hate to break it to you… They are not the same

In selecting the area in which you are going to sell from in this example, it will of course be inside of premium. The upper half of the dealing range that you are presented with. As explained in the YouTube video linked above on how to use accumulation fractals in your trading, I elected to use the Inverse Fair Value Gap.

As for the targeting system used for this trade, I used my target selection tool which I call my N30 Projections. This is a method whereby I use the Manipulated Range in order to keep my take profit 2 Standard Deviations away. However, in reality I just kept my profit target at the immediate range low just to call it a day.

The Role played by our Bias Predictor

As you, the audience know by now from our social media, we have a bias predictor that accurately predicts the bias for any asset under the US Regulatory Framework. It works 75%+ of the time and when there’s no extreme manipulation and there are obvious points of interests nearby, it has a successful prediction rate of 100%. While the indicator that is out (which is a paid by the way!) predicts the daily bias, we have techniques using nodes of time and price that predicts the bias for individual session and custom segments of time.

We used a mixture of both to solidify our reasoning for this sell on NASDAQ that spanned both the AM Session and the PM Session.

Concluding Note

I hope you found this insightful and be sure to leave a like and share this blog around if you found this content interesting.

Now, if it opened up rabbit holes for you, all you have to do is join us in our private mentorship. I’ll even throw in a lifetime discount of 20% (Code: tta20)

Sign up: https://finservcorp.net/the-trading-academy/

Categories
London Trading

Mastering Time-Based Trading: A London Time-Based Interval for Success

The Main Condition

In order for price to move, it is vital to understand why it moves. According to ICT (The Inner Circle Trader), price has two functions:

  • Fill up Inefficiencies (commonly referred to as Fair Value Gaps)
  • Purge Liquidity (raids on liquidity for the purposes of off-setting positions against counterparty participants in the market place)

Keep this in mind for what I am about to tell you with regard to time-based trading.

The London Time Interval: Sweet Spot

During the London Session, characterised as between 02:00AM EST to 06:00AM EST, there is a sweet spot of time derived from our amalgamation of 90-minute delivery intervals.

This sweet spot is between 02:30AM EST to 04:30AM EST. In this time interval, you want price to either be coming from fulfilling one of its two algorithmic functions or make its way towards performing that function. From there onwards, your job is to secure your entry using a trading technique within a trading strategy that fits your personality and your personality alone

Here is an example from Friday, 08th of September 2023:

Over here, you can see that the optimal entry, in the form of a retracement in price occurred that allowed a position to be taken to go short.

Concluding Note

It is vital to do your own backtesting to get used to this idea and to be able to see how time-based trading can change the way you look at price. It is not always about Fair Value and Liquidity. Time will always deliver price.