+60115141083

finserv0919@gmail.com

Categories
Fundamental Analysis Fundamental Analysis with FinServCorp

Why and How Is Gold Fundamentally Bullish For The Time Being?

Gold is an asset that gains traction during periods of low interest and / or high inflation. Therefore, it is an alternative asset class most of the time for investors to pour their money into.

High Interest Rate Environments

Higher interest rates attract investment flows into interest bearing securities. As such, money circulation goes out of Gold, thereby causing a Gold market crash. The opposite is true for a Low Interest Rate Environment

High Inflation Environments

When facing periods of high inflation, Gold is seen by investors as an inflation-hedge. Therefore, the money flowing into Gold is seen to increase. Thereby causing a Gold market rally. The opposite is true for a High Interest Rate Environment

Deriving a Bias using Interest Rates and Inflation Numbers

Interest Rates are the key economic and financial indicators that control all markets. Bonds and their rates set by the Fed rule all asset classes. Whereas, inflation is only a ‘pseudo-state’ of an economy.

If interest rates are seen to rise while inflation is low, Gold is definitely bearish as money will flow into interest bearing securities

If interest rates are seen to rise while inflation is high, Gold is still bearish as interest bearing securities would offer more in terms of higher interest that will counter the inflation as per inflation adjusted returns

If interest rates are seen to not change while inflation is high, Gold will spark a bull run as there is no particular interest in the interest bearing securities if there is no rise in the interest rates

If interest rates are seen to not change while inflation is low, Gold will face a sideways market or a crash as there will be no particular interest in the interest bearing securities or Gold themselves. Money will flow into the stock market

If interest rates are seen to be low while inflation is either high or low, money will still flow into Gold as that is the only attractive asset for this economic condition

To Conclude

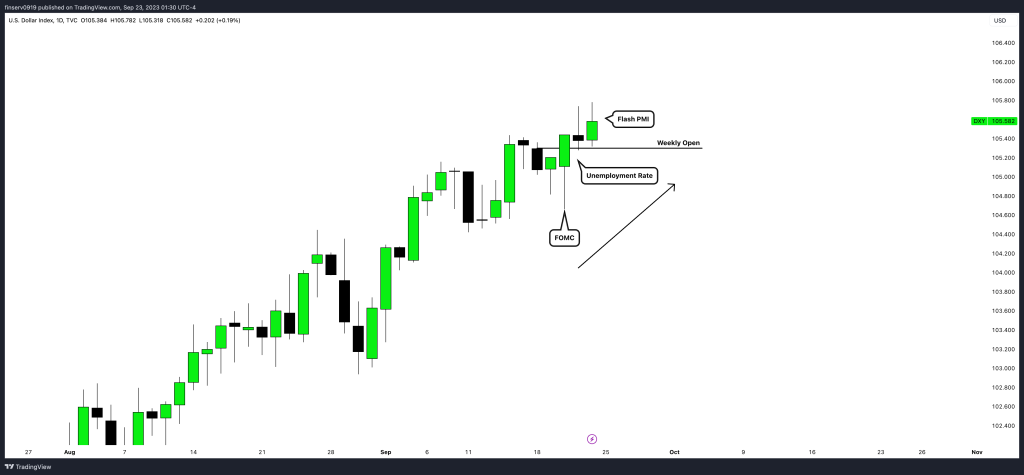
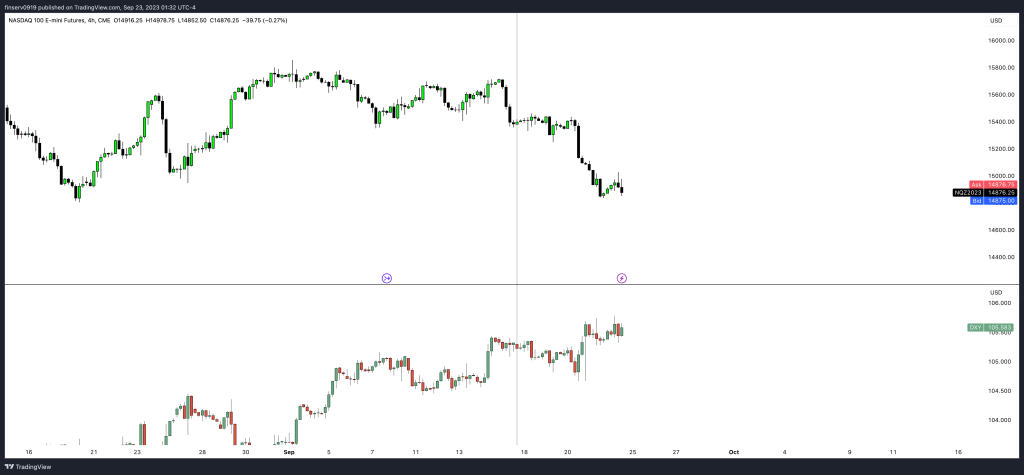
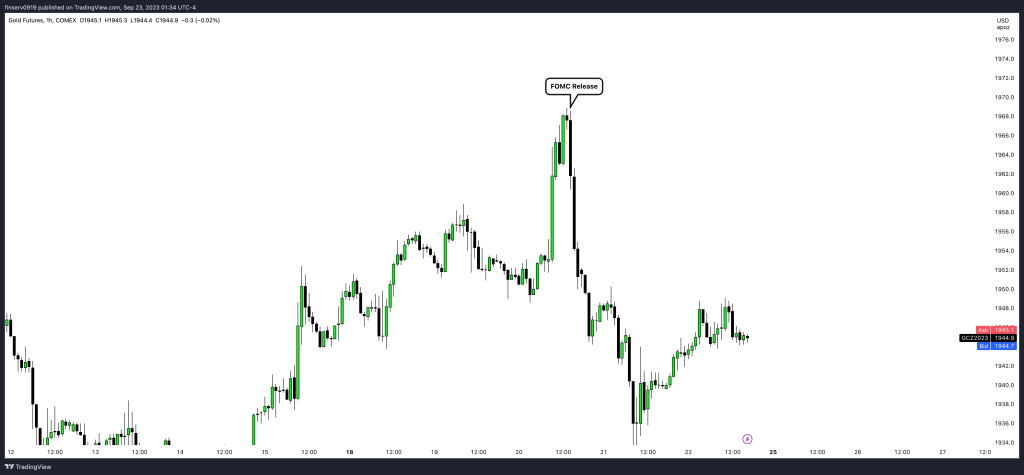
When looking at the weekly expansion of Gold or any asset class for that matter, it is important to note that the expansion itself is a consequence of the prevailing economic condition at hand. These things are set the previous week or during the current week after a High Impact News Driver has occurred.

Be sure to follow us on instagram at @finservcorp and subscribe to our YouTube at @shaundytradesfx to keep up with our time-based trading content and updates to Mentorship Enrolments!

Categories
Uncategorized

The Impact of Global News on Forex Markets

The foreign exchange (forex) market is the largest and most liquid financial market in the world, with daily trading volumes exceeding $6 trillion. Given its global nature, the forex market is influenced by a myriad of factors, with global news being one of the most significant drivers. In this article, we’ll delve deep into understanding how global news events impact currency valuations and forex trading.


1. Understanding the Basics

Before diving into specifics, it’s essential to understand that the forex market operates 24 hours a day, five days a week, spanning across major financial centers like London, New York, Tokyo, and Sydney. This continuous operation means that forex traders need to be on their toes, monitoring global news around the clock.


2. High Impact News Drivers

Several news events have a profound impact on currency valuations. Some of the most influential include:

  • Central Bank Decisions: Announcements related to interest rates, monetary policy, and quantitative easing can lead to significant forex market movements. For instance, a rate hike by the Federal Reserve can boost the US dollar as higher interest rates offer lenders better returns relative to other currencies.
  • Economic Indicators: Data releases such as GDP growth, unemployment rates, inflation rates (CPI), and trade balances provide insights into a country’s economic health, influencing its currency’s value.
  • Political Events: Elections, referendums, and geopolitical tensions can introduce uncertainty, leading to currency volatility. For example, Brexit led to significant fluctuations in the British Pound.
  • Natural Disasters and Pandemics: Unexpected events like earthquakes, hurricanes, or global health crises (e.g., COVID-19) can have short-term impacts on a country’s currency.

3. The Role of Forex Calendars

Platforms like MyFXBook and ForexFactory offer forex calendars that list upcoming news events, their expected impact, and the actual vs. forecasted data. These calendars are invaluable tools for traders, helping them anticipate market movements and strategize accordingly.


4. The Immediate Reaction

Upon the release of significant news, the forex market can react almost instantaneously. Automated trading systems, also known as algorithmic trading, can execute trades within milliseconds, leading to rapid price movements. It’s not uncommon to see major currency pairs move by 50-100 pips or more within minutes of a high-impact news release.


5. The Importance of Sentiment Analysis

Beyond the actual news data, traders also gauge market sentiment. For instance, even if an economic indicator is positive, if it doesn’t meet market expectations, the currency might still decline. Sentiment analysis tools can help traders understand the market’s mood and make informed decisions.


6. Strategies for Trading News Events

Forex traders often employ specific strategies for trading news events. Some might take positions before the news release, anticipating the market’s move, while others might wait for the news and then trade based on the market’s reaction. It’s crucial to have a risk management strategy in place, given the increased volatility during these times.


7. Conclusion

Global news plays a pivotal role in shaping the forex market’s dynamics. Whether you’re a seasoned trader or just starting, understanding the impact of news events and how to navigate them is crucial for success. By staying informed, using tools like forex calendars, and employing sound strategies, traders can capitalize on the opportunities presented by global news events.

If you are one of the inconsistent and strategy-hopping few in the trading community looking to better yourself and your trading, make sure to send us an email or a message on telegram to get you started on our exclusive One on One mentorship strictly designed for your success

Telegram:


Disclaimer: Forex trading involves significant risk of loss and is not suitable for all investors. Always conduct thorough research and consult with a financial advisor before making trading decisions.

Categories
London Trading

London Fractal Dealing Range

So, you are here because our Fractal Dealing Range caught your eye right? Well that is good. Not good, in fact it is great! In this short blog post, I will be covering the exact steps you need to go through in order to master the London Fractal Dealing Range. It is a constant and will never change.

How To Define The Fractal Dealing Range

Now, the Dealing Range of concern within the London Session’s Time Range as per our London Time Range Model is between 03:10AM EST and 03:30AM EST. You will be focusing on the closing prices of the candle that made the highest high and the candle that made the lowest low.

If price breaks out to the upside and the underlying context behind price movement is Bullish based on our Fractal Time Principle and Fractal Liquidity Sequential Principle, the low of the Fractal Dealing Range has an 80%+ probability of holding for the day or for the London Session only (Depends on HTF analysis OBVIOUSLY)

If price breaks out to the downside and the underlying context behind price movement is Bearish based on all the same points as the above, the high of the Fractal Dealing Range has an 80%+ probability of holding for the day or for the London Session only

Low Probability Conditions

When there is a High Impact News Driver, the Fractal Dealing Range may see a whipsaw in price unless liquidity has already been taken or a gap has been filled prior to the breakout of the Fractal Dealing Range. If none of them has been fulfilled as per the base function of price, wait for the High Impact News Driver to pass and see what you can do then

Using the Fractal Dealing Range as a POI Selector and Inversion Levels

This very range houses all the most important POIs relevant to the day and relevant in the future if they remain unmitigated. When price trades through the Fractal Dealing Range in the direction opposite to the initial breakout, the range itself can be inverted and you can find POIs within it across TIME. Remember, the act of moving in the horizontal plane is the movement of TIME and not PRICE. Price is applied vertically and Time is applied horizontally. Don’t worry, you can’t do much with that last piece of information 🙂

Conclusion

If you want a few chart examples, be sure to go check out our YouTube Video down below:

If you ever are in need of mentoring in order to make your trading easy and to solve any and all issues you may have, you can send a message to shaundytradesfx on telegram (no other special characters in the username)

Categories
Market Updates

Market Update: DXY Rises Amidst Positive Fundamentals, Index Futures Crash, and Gold’s Volatile Rally

The financial markets have been buzzing with activity this week, and the Dollar Index (DXY) has been at the forefront of many discussions. Here’s a breakdown of the key events and their implications:

1. DXY (Dollar Index) Rises Amidst Positive Fundamental Outputs

The Dollar Index, which measures the value of the US dollar against a basket of six major world currencies, has seen a significant uptick. This rise can be attributed to positive outputs from high-impact news drivers. While specific data points from this week’s USD fundamental data were not immediately available, it’s evident that the US economy has been posting encouraging numbers. Investors and traders should keep an eye on sources like Dukascopy Bank and DailyFX for detailed fundamental analyses and updates.

2. Index Futures Crash

In a surprising turn of events, index futures took a nosedive. While the exact reasons for this sharp decline are still being analyzed, it’s crucial for traders and investors to remain vigilant and monitor global economic indicators and geopolitical events that could influence market sentiment.

The relationship between the DXY and NASDAQ in this case is negative. When DXY rises, NASDAQ should fall.

3. Gold Rallies but Retreats Post-FOMC

Gold, often considered a safe-haven asset, witnessed a rally earlier this week. However, post the Federal Open Market Committee (FOMC) meeting, it gave back half of its gains. The FOMC’s decisions and statements play a pivotal role in influencing the price of gold, as it often moves inversely to the US dollar.

Conclusion:

The financial markets are in a state of flux, with the DXY showing strength, index futures facing headwinds, and gold exhibiting volatility. As always, traders and investors are advised to stay informed, keep an eye on global economic indicators, and make decisions based on thorough research and analysis.

For those interested in diving deeper into the intricacies of the financial markets and the factors influencing them, stay tuned to our blog for regular updates and in-depth analyses.

Categories
Fundamental Analysis with FinServCorp

Unemployment Rate in Forex Trading: A Comprehensive Guide | FinServCorp

Introduction

The unemployment rate is more than just a statistic; it’s a powerful indicator of a country’s economic health and a significant driver in the forex market. For traders, understanding the nuances of the unemployment rate can be the key to predicting market movements and making informed trading decisions.


Historical Trends of the Unemployment Rate

Over the past few decades, the unemployment rate has seen its highs and lows, often correlating with global economic events. For instance:

  • The 2008 financial crisis saw a sharp spike in unemployment rates globally, with the U.S. reaching a peak of 10% in October 2009.
  • The COVID-19 pandemic in 2020 led to unprecedented job losses, pushing the U.S. unemployment rate to 14.7% in April 2020, the highest since the Great Depression.

These fluctuations often mirror broader economic trends, making the unemployment rate a crucial metric for traders to monitor.


Impact on the US Economy and Forex Market

The unemployment rate directly affects consumer spending, which accounts for a significant portion of the U.S. GDP. High unemployment can lead to:

  • Decreased Consumer Confidence: When job security is low, consumers tend to spend less, impacting sectors like retail, real estate, and manufacturing.
  • Reduced Central Bank Interest Rates: To stimulate the economy, central banks might lower interest rates, which can weaken the currency in the forex market.
  • Foreign Investment Fluctuations: High unemployment can deter foreign investors, leading to reduced demand for the country’s currency.

For forex traders, these shifts can signal potential market movements, offering opportunities for strategic trades.

Monthly Unemployment Rates 2023 (Statista, 2023)

Trading Strategies Around the Unemployment Rate

  1. Anticipate the News: Major unemployment announcements can lead to market volatility. Traders can set up positions in anticipation of these announcements.
  2. Trade the Rumor, Sell the News: Often, the market will move in anticipation of a news event and then correct after the announcement. Recognizing this pattern can be profitable.
  3. Leverage Technical Analysis: Combine unemployment data with technical indicators such as our Bias Predictor to identify potential entry and exit points along with the bias

Conclusion

The unemployment rate is a pivotal economic indicator that can offer valuable insights for forex traders. By understanding its historical context, current implications, and potential market impact, traders can make more informed decisions. Dive deeper into such insights with FinServCorp’s comprehensive mentorship on how you can achieve greatness with our Time-Based Trading Strategies.

So if you want to master the art of understanding economic indicators and putting that understanding to profitable use, join The Trading Academy today!

Categories
Fundamental Analysis with FinServCorp

A Comprehensive Breakdown: Unemployment Rates Explained!

The world of trading is filled with numerous indicators and data points that traders use to make informed decisions. One such crucial indicator is the Unemployment Rate. But what is it, and why does it matter so much to traders, especially those trading the Dollar Index? Let’s dive in.

What is the Unemployment Rate?

The Unemployment Rate represents the percentage of the total labor force that is unemployed but actively seeking employment and willing to work. It’s a key indicator of economic health. When the economy is doing well, companies hire more workers, leading to a decrease in unemployment. Conversely, during economic downturns, companies lay off workers, leading to an increase in the unemployment rate.

How the Unemployment Rate Affects Economics

  1. Consumer Spending: High unemployment typically leads to a decrease in consumer spending. When people are out of work, they tighten their belts and spend less, which can lead to a slowdown in the economy.

  1. Central Bank Policies: Central banks, like the Federal Reserve in the U.S., closely monitor the unemployment rate. If unemployment is high, they might lower interest rates to stimulate borrowing and investment, aiming to boost job creation.

  1. Investor Confidence: A rising unemployment rate can shake investor confidence, leading to stock market declines. Conversely, a decreasing unemployment rate can boost investor confidence and lead to stock market gains.

Unemployment Rate and the Dollar Index

The Dollar Index (DXY) measures the value of the U.S. dollar relative to a basket of foreign currencies. It’s a barometer of the dollar’s strength and the U.S. economy’s health. Here’s how the unemployment rate can influence it:

  1. Direct Correlation: Generally, a rising unemployment rate can weaken the U.S. dollar, as it indicates potential economic troubles. Conversely, a decreasing unemployment rate can strengthen the dollar, signaling economic growth.
  2. Interest Rates: As mentioned, central banks might adjust interest rates based on unemployment. Lower interest rates can lead to a weaker dollar, while higher rates can strengthen it.
  3. Foreign Investment: A strong U.S. job market can attract foreign investment, boosting demand for the dollar. Conversely, high unemployment can deter foreign investment, leading to decreased demand for the dollar.

Different Kinds of Unemployment Rate Readings

  1. Seasonal Unemployment: Occurs when people are unemployed at certain times of the year because they work in industries where they aren’t needed all year round.
  2. Structural Unemployment: Caused by shifts in the economy that create a mismatch between the skills workers have and the skills needed by employers.
  3. Cyclical Unemployment: Related to the regular ups and downs of the economy.
  4. Frictional Unemployment: Occurs when workers leave their old jobs but haven’t yet found new ones.

Each type of unemployment can have a different impact on the economy and, by extension, the Dollar Index. For instance, cyclical unemployment, which rises during economic downturns, can have a more pronounced effect on the dollar than frictional unemployment.

Concluding Note

The Unemployment Rate is more than just a number. It’s a reflection of the economy’s health and a key indicator that traders use to predict future economic movements. By understanding its nuances and implications, traders can make more informed decisions, especially when trading instruments influenced by the U.S. economy, like the Dollar Index.

Remember, while the Unemployment Rate is a powerful tool, it’s essential to consider it alongside other economic indicators for a comprehensive view of the market.

Also, be sure to be on the lookout for the YouTube video doing an in-depth explanation on this matter with chart examples!


Stay tuned for more insights and deep dives into the world of trading and economics. Knowledge is power, and we’re here to empower you.

Categories
London Trading

The Ultimate Guide to the London Time Range Strategy: Everything You Need to Know

The London Time Range strategy is one of the most powerful London Session trading models that we use. While, it goes far deeper than what you are about to read, you should be able to do well with the objective rules that you are about to be given. As for chart examples, stay tuned for the YouTube video about this strategy.

The time range, as with all our time-based approaches to price, is based on the doubling theory and the nodes of time used by us.

The Time Range

The time range falls within the following 2 times:

  • 2.30AM EST
  • 4.30AM EST

The London Time Range falls within these two times:

  • 2.30
  • 4.30

This is combination of our 90-minute Liquidity Cycles that we have been working on since ICT (The Inner Circle Trader) mentioned it on his Telegram channel before he closed it down

As the pioneer of the APPLICATION of the 90-minute Liquidity Cycles, this London Time Range is a GOLDMINE for London Setups

In saying that, we prefer using most of our trading models on Gold and NASDAQ as they are the asset classes that provide the most volatility in trading the financial markets. That also means a faster stop loss. But you’ll be careful right?

The Purpose of this Time Range

To engage in the continuation of price or the reversal of price based on where price is relative to the 00.36AM EST Opening Price. This is another data point derived from our Fractal Time Theory, something that we focus on heavily in the mentorship and our One on One mentorship as well.

We understand that price moves to liquidate or to rebalance inefficient areas of price. This time range inside of London will seek to do exactly one of the two fundamental functions of price.

Remember, premium is considered as above the 00.36AM EST Opening Price and discount is considered to be below this Opening Price.

Algorithmic Delivery

Most ‘Smart Money’ / ‘ICT Gurus’ claim that the London Session is a breeding ground for liquidity and by that point, people should avoid getting ‘slaughtered’. That’s just pure stupidity. They have no clue what they are doing 🙂

We BEG to differ! Any time interval, any session. We trade them all with our Algorithmic Theory, The Fractal Time Theory (Mentorship only)

Every Session is to be treated as an isolated ‘incident’. Only when you are taking the ENTIRE DAY into account will you be considering the London Session as a phase of intra-day manipulation.

How Do I Apply This Algorithmic Theory?

Simple.

Step 1:

Before you start trading London, you are waiting for it to be the right time of day. in this case, the 2.30AM EST to 4.30AM EST Time Range

Step 2:

You will then identify whether price is REVERSING or CONTINUING

Step 3:

Depending on your trading model, enter a position. Note that you are entering with confluencing factors such as displacement, fair value gaps, etc.

Concluding Note

For chart examples and an in-depth explanation of this strategy or model as the cool kids like to call it, be sure to watch out for our YouTube video on the subject matter.

If you are keen on learning the Fractal Time Theory and all our time-based approaches to trading, be sure to check out our mentorship below:

https://www.finservcorp.net/the-trading-academy/

Note: The services provided by FinServCorp will be changing into a High Ticket System

$85/Month: Mentorship Access to Video Library

$120/Month: Mentorship Access to Video Library + Discord Community

$150/Month: Mentorship Access to Video Library + Discord Community + Resources + 4 One on One Sessions a Month (Free)

From the end of the first quarter of 2024 it will be:

$2000 upfront fee: 1 Week of Intensive One on One Sessions learning all you need to know

This is followed by a 6 month grace period of having access to everything for free and to recoup your investment. After the 6 months are done with, it will be $150/Month to retain your membership.

The reason for this is we want to retain high quality members that consider their education an investment and not a time-pass.

Stay tuned for the Blog Post explaining this change. Until then, good luck and good trading 🙂

Categories
Fundamental Analysis with FinServCorp

THE Economic Indicator you NEED TO KNOW!

Consumer Price Index (CPI)

In the vast landscape of economic indicators, the Consumer Price Index (CPI) stands tall as a beacon for understanding inflation and the purchasing power of money. But what exactly is the CPI, and how does it influence the Dollar Index and the broader financial markets? Let’s dive in and demystify this crucial economic metric.

What is the Consumer Price Index (CPI)?

The CPI measures the monthly change in prices paid by U.S. consumers for a specific basket of goods and services. Think of it as a barometer for the cost of living. The Bureau of Labor Statistics (BLS) calculates the CPI as a weighted average of prices for a basket representative of aggregate U.S. consumer spending.

Understanding the Consumer Price Index

  • The BLS collects about 80,000 prices monthly from approximately 23,000 retail and service establishments.

  • Shelter category prices, accounting for a third of the overall CPI, are based on a survey of rental prices for 50,000 housing units.

  • The CPI includes user fees and sales or excise taxes but excludes income taxes and the prices of investments like stocks or bonds.

CPI and the Dollar Index

The Dollar Index gauges the U.S. dollar’s strength against a basket of major currencies. Here’s how the CPI plays a role:

  • Positive CPI Readings (MoM, YoY): A rise in the CPI indicates inflation, which can strengthen the U.S. dollar as it may signal a robust economy attracting foreign investments.

  • Negative CPI Readings: A drop in the CPI can weaken the dollar, suggesting potential economic challenges that might deter foreign investments.

Types of Consumer Price Index

  • Consumer Price Index for All Urban Consumers (CPI-U): Represents 93% of the U.S. population, excluding those in remote rural areas.

  • Consumer Price Index for Urban Wage Earners and Clerical Workers (CPI-W): Covers 29% of the U.S. population, focusing on households with clerical employment or hourly wages.

CPI Formulas

The CPI calculation involves two main formulas:

  • Annual CPI Formula: This determines the annual CPI by comparing the value of a specific basket of goods today to one year ago.

  • Inflation Rate: This uses the current year’s CPI and the prior year’s CPI to calculate the inflation rate.

CPI Categories by Weight as of July 2023

GroupWeight
Housing34.7%
Food13.4%
Transportation5.9%
Commodities21.3%
Health Care6.4%
Energy7.0%
Education4.8%
Other Expenses6.5%

How is the Consumer Price Index Used?

  • The Federal Reserve: Uses CPI data to shape economic policy, targeting an inflation rate of 2%.

  • Other Government Agencies: Adjust federal payments, school lunch subsidies, and income tax brackets based on the CPI.

  • Financial Markets: React to CPI data, influencing stock prices, bond yields, and more.

  • Labor Markets: Use the CPI to negotiate wages and understand nationwide labor rate trends.

Concluding Note

The CPI is more than just a number; it’s a reflection of the economy’s health and a tool for making informed financial decisions. By understanding its intricacies, traders, investors, and everyday consumers can better navigate the financial markets and the broader economic landscape.

P.S. If you are interested in learning our precision-based & time-based approach to trading (which we pioneered by the way), be sure to enrol into The Trading Academy by FinServCorp.

The Trading Academy by FinServCorp

Categories
Fundamental Analysis with FinServCorp Uncategorized

Your Ultimate Guide to all things GDP with The Trading Academy by FinServCorp

Imagine sailing on the vast ocean of the financial world. The waves, the currents, the winds – they all have their sources. In our economic ocean, one of the mightiest winds is the Gross Domestic Product, or GDP. It’s a term you’ve likely heard, but what does it mean, and how does it influence the financial markets? Grab your compass and map; we’re about to embark on a journey to understand GDP.

What is Gross Domestic Product (GDP)?

GDP represents the total monetary value of all goods and services produced within a country’s borders in a specific time frame. Think of it as a health checkup for a country’s economy. It can be measured in three ways:

Production Approach: The value of output minus the value of intermediate consumption

Income Approach: The total compensation of factors of production (like wages and rents)

Expenditure Approach: The total spent on the country’s final output (often the most common approach).

How does GDP affect Economics?

Economic Health: A growing GDP indicates economic health, prosperity, and that the nation is producing more. Conversely, a declining GDP can signal a recession.

Policy Decisions: Governments and central banks use GDP as a key tool to make policy decisions, from interest rates to tax policies.

Investor Sentiment: GDP growth can influence where investors put their money. Strong GDP growth can attract foreign investors looking for the best place to park their money.

GDP and the Dollar Index

The Dollar Index measures the U.S. dollar’s strength against a basket of other major currencies. GDP plays a pivotal role in shaping this index:

  • Positive GDP Readings (MoM, YoY): Month-over-Month (MoM) or Year-over-Year (YoY) growth in GDP can strengthen the U.S. dollar. A growing economy can attract foreign investments, pushing up the demand for the dollar.

  • Negative GDP Readings: A contraction in GDP can weaken the dollar as it might indicate economic troubles, making U.S. assets less attractive to foreign investors.

GDP’s influence on Technical Analysis

While steering clear of the depths of technical analysis, it’s essential to recognize that GDP figures can create waves in the technical charts:

  • Price Movements: Significant GDP announcements can lead to sharp price movements, breaking through established support or resistance levels at what you may consider to be appropriate valuation points.

  • Volume Surges: High-impact news like GDP releases can lead to increased trading volumes, amplifying price movements.

Diving Deeper: Different GDP Readings

MoM (Month-over-Month): This reading compares the GDP of one month to the previous month. It’s a short-term metric and can be more volatile.

YoY (Year-over-Year): This compares the GDP of a specific quarter to the same quarter the previous year, providing a broader view of economic health.

Real vs. Nominal GDP: Real GDP accounts for inflation, giving a more accurate picture of an economy’s size and how it’s growing. Nominal GDP, on the other hand, doesn’t adjust for inflation.

Concluding Note

GDP isn’t just a number or a buzzword. It’s a vital sign of an economy’s health, influencing everything from government policies to the value of a nation’s currency. For traders and investors, understanding the nuances of GDP can provide a clearer picture of the economic landscape, aiding in making informed decisions.

So, the next time you’re charting your course in the financial markets, let the winds of GDP guide you. Safe sailing!

P.S. If you are looking to learn how to trade time-based elements that enables you to identify the bias in a matter of minutes, don’t forget to check out our private mentorship page out. You will not be disappointed!

The Trading Academy by FinServCorp

Categories
Fundamental Analysis with FinServCorp

Deciphering the Impact of the Federal Reserve Rate Decision on the Financial Landscape with The Trading Academy

The financial world often seems like a vast ocean, with waves created by various economic indicators. One such colossal wave-maker is the Federal Reserve Rate Decision. This decision, made by the U.S. central bank, has the power to influence global markets, from stocks and bonds to currencies. But what is this rate decision, and why does it hold such sway?

What is the Federal Reserve Rate Decision?

The Federal Reserve, often referred to as the Fed, is the central bank of the United States. One of its primary roles is to set the federal funds rate, which is the interest rate at which banks lend money to each other overnight. This rate affects the general structure of interest rates in the economy and, by extension, borrowing costs for households and businesses.

How Does the Rate Decision Affect Economics?

  • Borrowing Costs: When the Fed raises the rate, borrowing becomes more expensive, and when it lowers the rate, borrowing becomes cheaper. This dynamic can influence consumer spending on big-ticket items like homes and cars, as well as business investments.

  • Consumer Spending: Higher interest rates can lead to higher savings rates as people get better returns on savings accounts. Conversely, lower rates might encourage spending rather than saving.

  • Business Investments: Companies might hold off on expansions or new projects when borrowing is expensive, waiting for a more favorable rate environment.

The Federal Reserve Rate Decision and the Dollar Index

The Dollar Index (DXY) tracks the U.S. dollar’s performance against a basket of major world currencies. The Fed’s rate decision can have a pronounced effect on this index:

  • Rate Increases: A rate hike often strengthens the U.S. dollar. Higher interest rates offer lenders in an economy a higher return relative to other countries. As a result, higher interest rates attract foreign capital and cause the exchange rate to rise.

  • Rate Decreases: Conversely, a rate cut can weaken the U.S. dollar. Lower rates provide a lesser return on assets denominated in that currency and can lead to a shift of investments to other currencies with better returns.

Influence of the Rate Decision on Technical Analysis

While we won’t dive deep into the intricacies of technical analysis, it’s crucial to understand that significant fundamental events, like the Fed’s rate decision, can shape technical patterns:

  • Price Volatility: On days when the rate decision is announced, markets can experience heightened volatility, leading to potential trend shifts or accelerations.

  • Key Levels: Major announcements can push asset prices to test significant support or resistance levels in Discount and Premium, even if they’ve held firm for a long time.

Concluding Note

The Federal Reserve Rate Decision is a beacon in the financial seas, guiding traders, investors, and economists alike. Its influence is vast, affecting everything from the value of the dollar to the decisions made by businesses and consumers. By understanding its impact, one can navigate the financial markets with greater clarity and confidence.

Stay with us for more insights into the fascinating world of trading and finance! More data driven insights to come!

If you are interested in enrolling in the mentorship where you get access to a goldmine of information and resources, be sure to check this link out:

https://www.finservcorp.net/the-trading-academy/